Thank you Don. Your dedication and attention to this mailing list is to be commended. Your advice has worked its charm every time. Thanks.
For the record and other future newbie users, I have managed to create an overlay using a grid set of values that correspond to 3 different colors. Essentially I used the following:
public class MyGridLayer extends Layer {
:
:
OMGridData.Int rgbGridData = argb_GridData(someArrayOfIntVals);
OMGrid omGrid = new OMGRID(lat_min, lon_min,
deltaLat, deltaLon, rgbGridData );
SimpleColorGenerator gen = new SimpleColorGenerator();
omGrid.setGenerator(gen);
this.omgraphics.addOMGraphic(omGrid);
}
This works well. I'll just have to optimize the color generator so that a new OMRaster is created only when the projection changes, and not everytime you pan or change position.
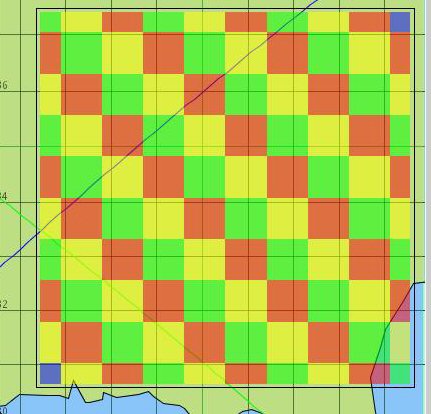
QUESTION that remains. I did a checkered pattern (10x10 grid) to test this OMGrid and I notice that the cells on the edges of the checker board are essentially cut in half. I was wondering if you (or anyone else) could please explain this effect. I've attached a small image that illustrates what I'm seeing. Is this a function of how the generator places the pixels in the OMRaster ?
tia
Don Dietrick <dietrick_at_bbn.com> wrote:
There's an OMGrid object that handles this situation. You create one
where the grid should be overlayed, and give it an OMGridGenerator that
creates OMGraphics from the data values within the grid. There are
example OMGridGenerators in the package.
I think you might want to check out the version from CVS, I did some
work this year on OMGrids that might make it easier to use them for
your data values. CVS instructions are on the website download page.
There is more information about OMGrids in the javadocs.
Regards,
Don
On Jul 8, 2004, at 5:02 PM, serrotam wrote:
>
> I would appreciate advice on how to approach the
> rendering of a (2D)grid of values that need to be
> rendered as an overlay on a lat-lon map.
>
> grid of values can be as large a 2000x2000 where
> each value will correspond to a colored square of a
> few kilometers each.
> ____________________________
> | red | yellow | green | ...
>
> | red | green | yellow | ...
> | yellow | red | green | ...
> | : | : | : | ...
>
> Which is the most efficient way of creating this
> layer? I.e. with an OMRaster or OMPolygons?
>
> What are good examples for setting OMRaster
> projections? these are still a bit confusing to me.
> appreciate any hints.
> TIA
>
>
>
---------------------------------
Do you Yahoo!?
Yahoo! Mail - 50x more storage than other providers!
--
[To unsubscribe to this list send an email to "majdart_at_bbn.com"
with the following text in the BODY of the message "unsubscribe openmap-users"]
Received on Tue Jul 27 2004 - 10:55:03 EDT